使用clusterProfiler完成GO富集(含R脚本)
关于GO富集的原理
这里直接引用很早之前在实验室汇报的PPT,节选了其中的一部分
R脚本
1、使用R中最经典的方法clusterProfiler进行GO富集分析并可视化绘图,首先下载、引包,并且下载基因组,设定数据路径
org.At.tair.db是拟南芥基因组org.Dm.eg.db是果蝇基因组org.Hs.eg.db是Human基因组
if (!requireNamespace("BiocManager", quietly = TRUE))
  install.packages("BiocManager")
  BiocManager::install(version = "3.12")

BiocManager::install("clusterProfiler")
BiocManager::install("org.At.tair.db")

library(org.At.tair.db)
library(clusterProfiler)
setwd("F:/Rcode/GO-term/LJW")2、使用enrichGO函数进行GO注释和富集:
gene参数传入一个读取基因的listdb参数传入指定的基因组数据库,keyType参数传入基因ID的类型(可以使用keytypes(org.At.tair.db)命令可以查看基因组支持的ID类型)ont参数指定GO富集的词条,其中GO分为生物学过程(BP)、细胞组分(CC)、分子功能(MF)三部分,可以合并在一起(ont="ALL")进行注释富集,也可以像下面案例代码分开pAdjustMethod、pvalueCutoff、qvalueCutoff、readable参数一般不改(通常只有在富集出词条特别少时会调大)
d1 <- read.table("GO-genelist.txt", header = F)
d1 <- c(d1[,1])
keytypes(org.At.tair.db)
BP.params <- enrichGO(gene=d1 ,'org.At.tair.db', ont="BP", keyType = "TAIR",
pAdjustMethod="BH", pvalueCutoff=0.01, qvalueCutoff=0.05,
readable = TRUE)
CC.params <- enrichGO(gene=d1 ,'org.At.tair.db', ont="CC", keyType = "TAIR",
pAdjustMethod="BH", pvalueCutoff=0.05, qvalueCutoff=0.05,
readable = TRUE)
MF.params <- enrichGO(gene=d1 ,'org.At.tair.db', ont="MF", keyType = "TAIR",
pAdjustMethod="BH", pvalueCutoff=0.01, qvalueCutoff=0.05,
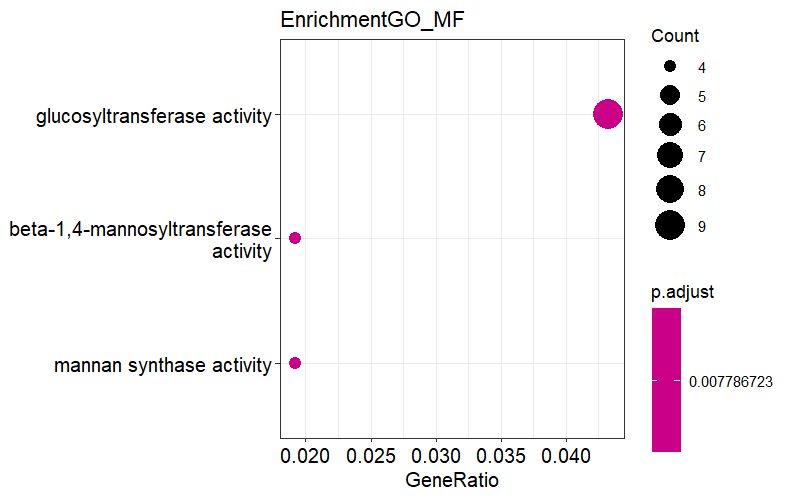
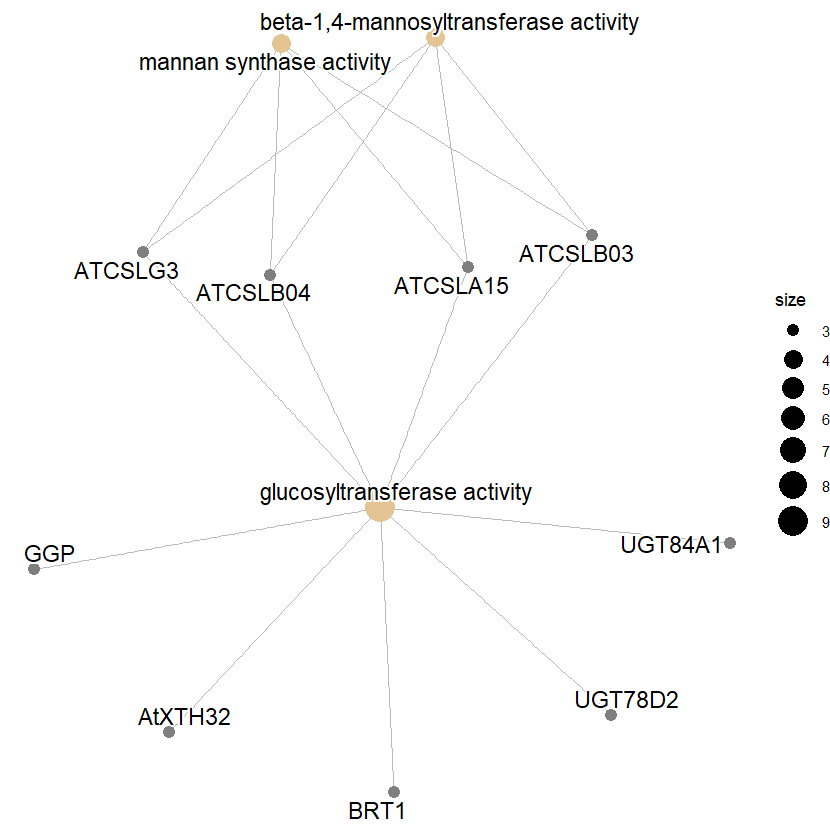
readable = TRUE)3、clusterProfiler支持3种方法可视化富集结果,其中barplot和dotplot具有相同的信息,cnetplot展示被富集词条的相关基因
barplot(BP.params, showCategory=30, title="EnrichmentGO_BP SZ20213020178 LJW")
barplot(CC.params, showCategory=30, title="EnrichmentGO_CC SZ20213020178 LJW p=0.05")
dotplot(MF.params, showCategory=30, title="EnrichmentGO_MF")
cnetplot(MF.params, categorySize="pvalue", foldChange=d1, title="EnrichmentGO_MF")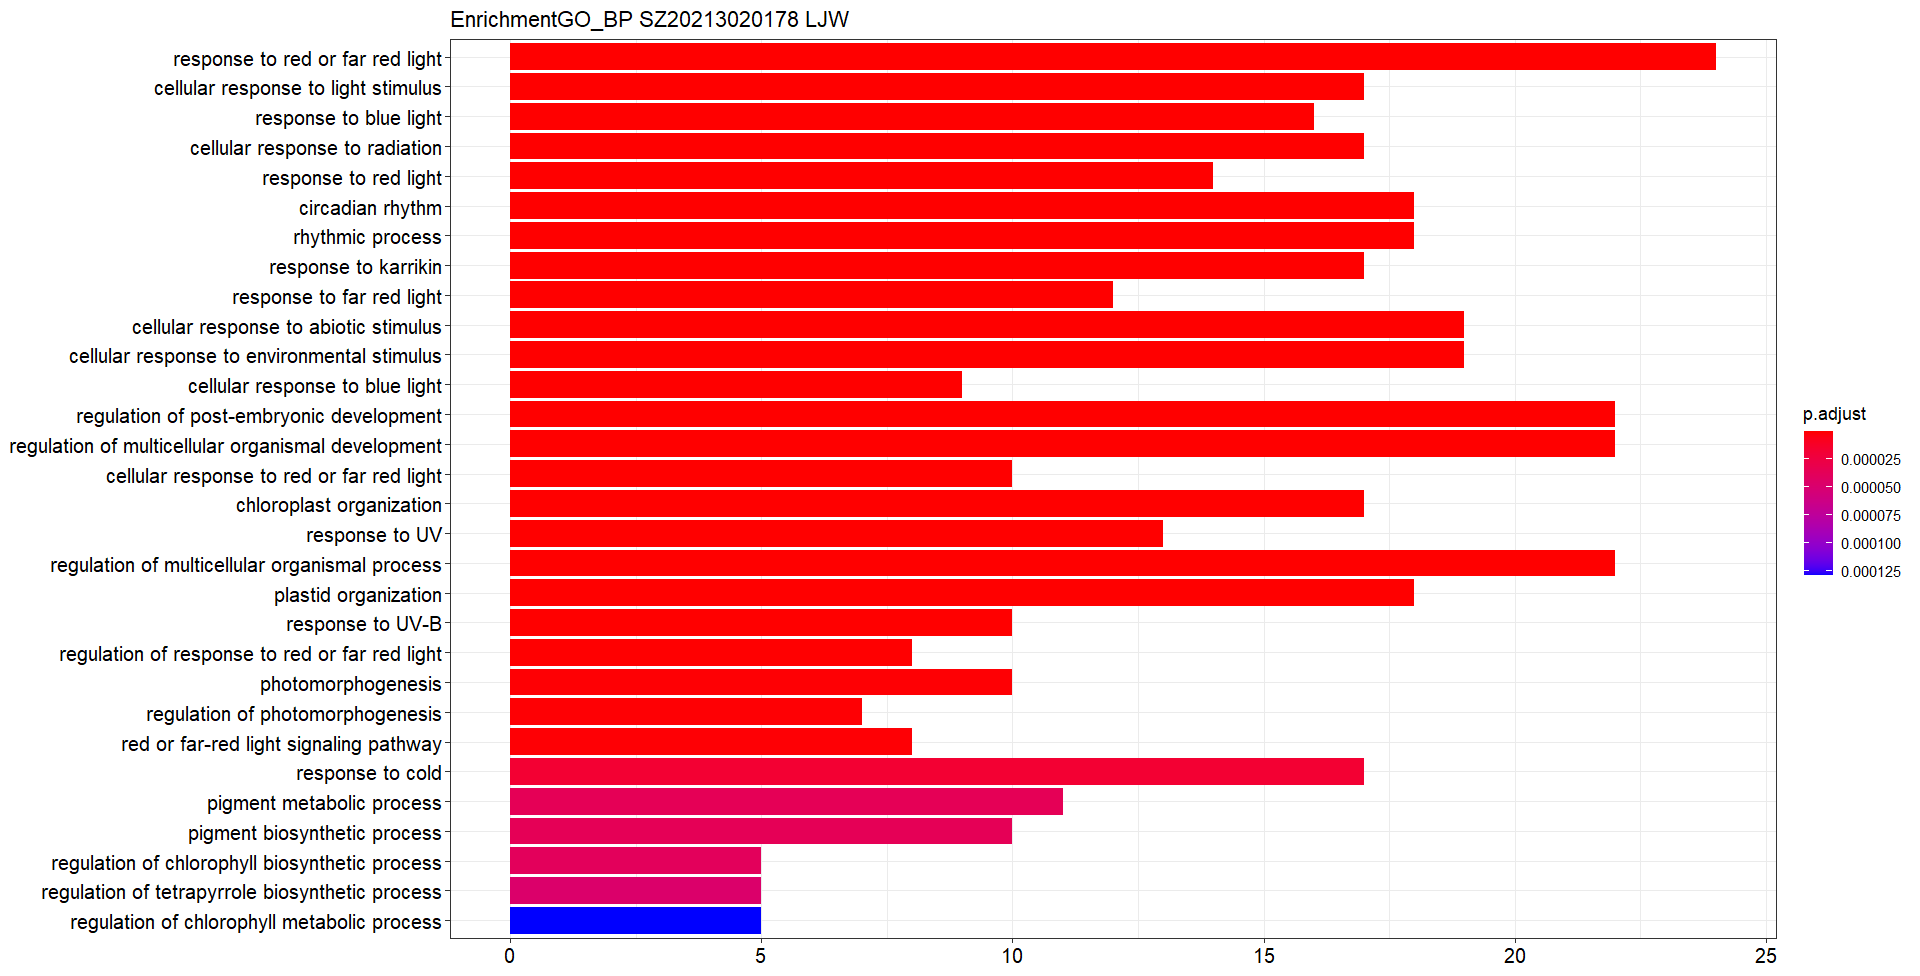
4、GO富集的结果可以直接保存出来,选择合适的词条部分绘图