OpenCV | 图像的空间域处理之点运算
在给定图像的像素上直接进行运算的方法称之为图像空间域的处理;而根据所操作的像素的多少和类型分为:
- 单像素操作(点运算):即对单个像素点进行处理
- 邻域操作:即对某一像素点的操作与该点周围的其他点相关
- 几何变换:对整张图片进行全局性的操作
- 形态学操作:对特定图像形状(边界、凸壳等)的处理或操作
本文介绍空间域处理的点运算,其主要有如下几种常见操作:图像加法、图像阈值、直方图均衡及图像的位运算
四、图像加法
直接相加
在opencv中,可以使用函数cv2.add()将某些图像的像素进行加法运算,当然也可以直接使用 Numpy,res=img1+img2。但需要注意的是:
-
相加的两幅图像尺寸、类型必须一致,或者可以直接加一个标量值
-
OpenCV的加法是一种饱和操作(相加超过255则等于255),而Numpy的加法是一种模操作(相加超过255之后则对255取模求余数)
x = np.uint8([250])
y = np.uint8([10])
print(cv2.add(x,y))
>> 255
print(x+y)
>> 4
图像混合
相比于加法,图像混合操作可能更使用一些,其本质也是加法,但却对图片作了不同的加权,给人一种混合或者透明的感觉,其计算公式如下:
$$
g(x)=(1− \alpha ) f_0(x)+ \alpha f_1(x) , \alpha \in [0,1]
$$
在opencv中,可以函数cv2.addWeighted(α, img1, β, img2, γ) 可以按下面的公式对图片进行混合操作,其具有更灵活的定义:
$$
dst = \alpha·img1 + \beta·img2+\gamma
$$
如下案例即把两幅图混合在一起,第一幅图的权重是 0.4,第二幅图的权重是 0.6,γ取值为 0:
import cv2
import numpy as np
from matplotlib import pyplot as plt

img1 = cv2.imread('image/A.jpg')
img2 = cv2.imread('image/B.jpeg')
plt.figure(figsize=(20,8))
plt.subplot(131), plt.imshow(img1[:,:,::-1]), plt.xticks([]), plt.yticks([])
plt.subplot(132), plt.imshow(img2[:,:,::-1]), plt.xticks([]), plt.yticks([])
dst = cv2.addWeighted(img1, 0.4, img2, 0.6, 0)
plt.subplot(133), plt.imshow(dst[:,:,::-1]), plt.xticks([]), plt.yticks([])
plt.show()
五、图像阈值
全局阈值
简单来说,阈值操作就是当某一像素值高于设定的阈值时,我们给这个像素赋予一个值,否则我们给它赋予另外一个值
阈值操作往往被用于图像分割、噪声修复等过程中
在opencv中,阈值操作的函数是cv2.threshhold(),该函数包含四个参数:
- 第一个参数是原图像,原图像应该是灰度图
- 第二个参数就是用来对像素值进行分类的阈值
- 第三个参数就是当像素值高于(有时是小于)阈值时应该被赋予的新的像素值
- 第四个参数决定OpenCV中的不同阈值方法,这些方法包括:
cv2.THRESH_BINARY:二值化操作,将大于阈值的部分设置为黑色(255),小于阈值的部分设置为白色(0)cv2.THRESH_BINARY_INV:反向二值化,将大于阈值的部分设置为白色(0),小于阈值的部分设置为黑色(255)cv2.THRESH_TRUNC: 大于阈值部分设为阈值,否则不变cv2.THRESH_TOZERO: 大于阈值部分不变,小于阈值的部分设置为白色(0)cv2.THRESH_TOZERO_INV:大于阈值部分设置为白色(0),小于阈值的部分不变
该函数具有两个返回值:
- 第一个为 retVal,为最终处理的阈值(当使用cv2.THRESH_OTSU时设定阈值会自适应变化)
- 第二个即是阈值化之后的图像结果
下面即是一个用不同阈值处理方法得到的图像:
import cv2
import numpy as np
from matplotlib import pyplot as plt

img = cv2.imread('image/03.png',0)
ret,thresh1 = cv2.threshold(img,127,255,cv2.THRESH_BINARY)
ret,thresh2 = cv2.threshold(img,127,255,cv2.THRESH_BINARY_INV)
ret,thresh3 = cv2.threshold(img,127,255,cv2.THRESH_TRUNC)
ret,thresh4 = cv2.threshold(img,127,255,cv2.THRESH_TOZERO)
ret,thresh5 = cv2.threshold(img,127,255,cv2.THRESH_TOZERO_INV)

titles = ['Original Image','BINARY','BINARY_INV','TRUNC','TOZERO','TOZERO_INV']
images = [img, thresh1, thresh2, thresh3, thresh4, thresh5]
fig = plt.figure(figsize=(14,8), dpi=80)
for i in range(6):
    plt.subplot(2,3,i+1),plt.imshow(images[i],'gray')
    plt.title(titles[i])
    plt.xticks([]),plt.yticks([])
plt.show()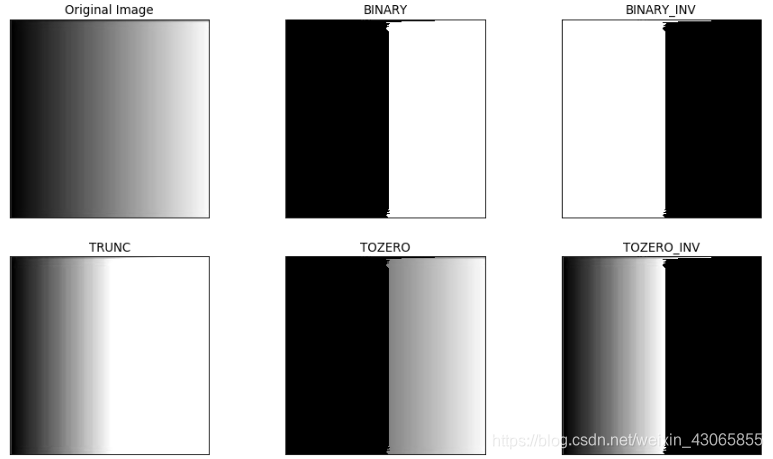
Otsu’s 二值化
Otsu是一种全局上自动选择阈值的方法,相比于人工地根据效果不断尝试,Otsu可以更快捷地根据图像的直方图给出相对较好的结果;
这里用到到的函数还是cv2.threshold(),但是需要多传入一个参数(flag):cv2.THRESH_OTSU
- 这时要把阈值设为0,然后算法会找到最优阈值,这个最优阈值就是返回值
retVal - Ostu的算法在解决双峰图像的分割时有奇效!
下面的案例中,输入图像是较暗,在使用127为全局阈值时效果并不好,可以通过Ostu的方法直接找到合适的阈值:
import cv2
from matplotlib import pyplot as plt

img = cv2.imread('image/01.jpeg',0)
ret1,th1 = cv2.threshold(img,127,255,cv2.THRESH_BINARY)
ret2,th2 = cv2.threshold(img,0,255,cv2.THRESH_BINARY+cv2.THRESH_OTSU)

images = [img, 0, th1,
          img, 0, th2]
titles = ['Original Image','Histogram','Global Thresholding (v=127)',
          'Original Image','Histogram',"Otsu's Thresholding(v={})".format(ret2)]

fig = plt.figure(figsize=(15,6), dpi=80)
for i in range(2):
    plt.subplot(2,3,i*3+1),plt.imshow(images[i*3],'gray')
    plt.title(titles[i*3]), plt.xticks([]), plt.yticks([])
    plt.subplot(2,3,i*3+2),plt.hist(images[i*3].ravel(),256)
    plt.title(titles[i*3+1])
    plt.subplot(2,3,i*3+3),plt.imshow(images[i*3+2],'gray')
    plt.title(titles[i*3+2]), plt.xticks([]), plt.yticks([])
plt.show()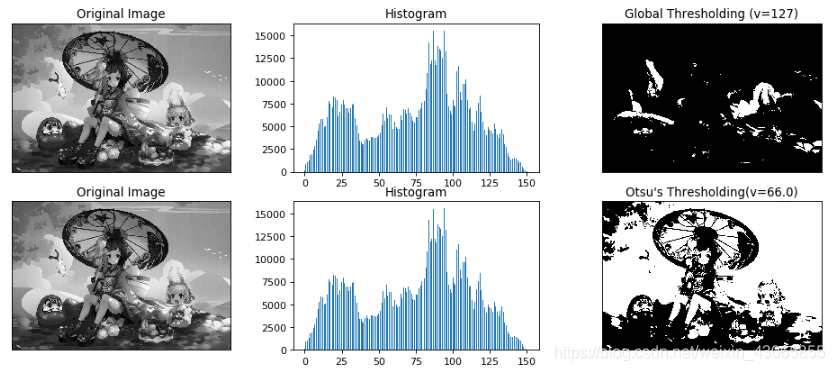
Ostu的具体算法为:
-
在某灰度图片上共有M*N个像素点,其平均灰度值为μ
-
根据某阈值T可将其分为两类,分别统计出大于/小于等于该阈值的像素点占总像素的百分比 ω1和 ω2,每一类的平均灰度值为μ1和μ2
-
根据平均数的定义,有$\mu=\omega_1*\mu_1+\omega_2*\mu_2$
-
在此基础上求得类间方差,为: $$ \begin{aligned} g(x)&=\omega_1*(\mu_1-\mu)^2+\omega_2*(\mu_2-\mu)^2 \\ &=\omega_1\omega_2*(\mu_1-\mu_2)^2 \end{aligned} $$
-
对于每一个阈值T,都可以计算出其间类方差g(T),Ostu即是找到了使得方差最小的阈值T
自适应阈值
当同一幅图像上的不同部分的具有不同亮度时,全局阈值并不能得到很好的效果,我们可能会希望根据具体情况对图片的不同位置使用不同的阈值,该操作称为自适应阈值
(严格来说,自适应阈值参考了领域的像素值,不能算是点运算,但为了保持连贯性就与阈值操作一同放在了点运算的这部分)
opencv提供cv2.adaptiveThreshold()函数完成自适应阈值的操作,其包含如下参数:

-
src为需要操作的图片
-
maxValue为设定的新像素值
-
adaptiveMethod是指定计算阈值的方法,通常为如下两种:
cv2.ADPTIVE_THRESH_MEAN_C:阈值取自相邻区域的平均值cv2.ADPTIVE_THRESH_GAUSSIAN_C:阈值取值相邻区域的加权和,权重为一个二维高斯核
-
thresholdType:即阈值处理的方式,只有两种可供选择
-
cv2.THRESH_BINARY:二值化,与全局阈值时含义相同,即 $$ dst(x,y) = \begin{cases} maxValue & if \ src(x,y) > T(x,y) \\ 0 & otherwise \end{cases} $$ -
cv2.THRESH_BINARY_INV:反向二值化 $$ dst(x,y) = \begin{cases} 0 & if \ src(x,y) > T(x,y) \\ maxValue & otherwise \end{cases} $$ -
Block Size:用于设置邻域的大小
-
C:一个常数C,阈值等于前面的输出结果减去这个常数
我们使用下面的代码来展示简单阈值与自适应阈值的差别:
import cv2
import numpy as np
from matplotlib import pyplot as plt

img = cv2.imread('image/02.jpg',0)
img = cv2.medianBlur(img,5)

ret,th1 = cv2.threshold(img,127,255,cv2.THRESH_BINARY)
th2 = cv2.adaptiveThreshold(img,255,cv2.ADAPTIVE_THRESH_MEAN_C,cv2.THRESH_BINARY,11,2)
th3 = cv2.adaptiveThreshold(img,255,cv2.ADAPTIVE_THRESH_GAUSSIAN_C,cv2.THRESH_BINARY,11,2)

titles = ['Original Image', 'Global Thresholding (v = 127)',
            'Adaptive Mean Thresholding', 'Adaptive Gaussian Thresholding']
images = [img, th1, th2, th3]

fig = plt.figure(figsize=(18,10), dpi=80)
for i in range(4):
    plt.subplot(2,2,i+1),plt.imshow(images[i],'gray')
    plt.title(titles[i])
    plt.xticks([]),plt.yticks([])
plt.show()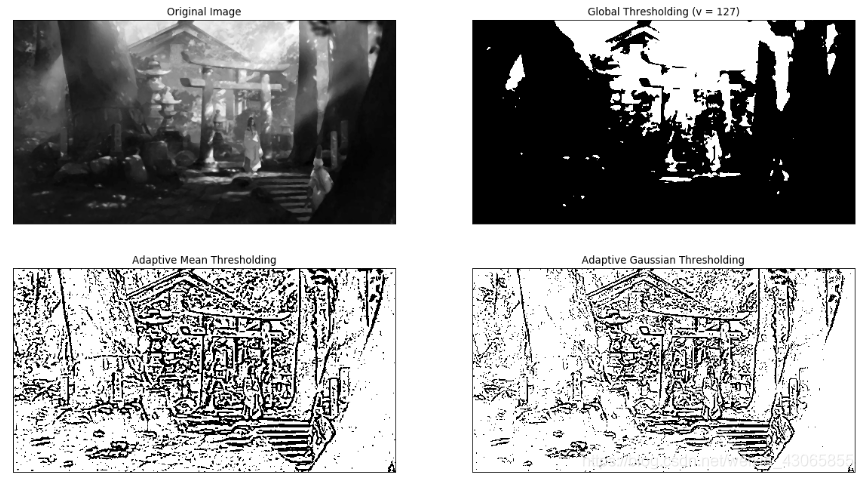
六、直方图均衡
统计直方图
直方图是对整张图片灰度值的频率统计直方图,通过直方图我们可以对图像的对比度,亮度,灰度分布等有一个直观的认识。OpenCV和Numpy都有内置函数做这件事:
方法一:使用opencv的内置函数
函数cv2.calcHist(images,channels,mask,histSize,ranges[,hist[,accumulate]])帮助我们统计一幅图像灰度值的频数,返回结果为包含统计结果的多维数组,其参数理解如下:

- images为需要分析的图片,需要以数组格式传入,即[img]
- channel为需要分析的通道,仍以数组格式传入,对于灰度图为[0];对于彩色图,可以是 [0],[1],[2],它们分别对应着通道 B,G,R
- mask,图像掩模(相当于选框),当要统计整幅图像的直方图就把它设为 None
- histSize,统计组的数目Bins,以数组格式传入,因为灰度值为[0, 255]的离散数据,其范围并不大,可以直接分为255组,即[256]
- ranges,像素值范围,通常为 [0, 256]
import cv2

img = cv2.imread('image/01.jpg',0)
hist = cv2.calcHist([img],[0],None,[256],[0,256])
hist
>> array([[ 52.], [ 14.],..., [3470.]], dtype=float32)方法二:使用Numpy的统计函数
使用Numpy中统计直方图的函数np.histogram()或np.bincount()可以完成这项任务,
np.histogram()通常使用前三个参数,返回一个包含统计结果的数组hist和分组的范围bins:
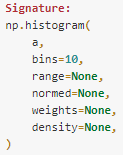
- a为原始数据,要求为一维数组的格式,可以对图片使用
img.ravel()或img.flatten()将其转换为一维数组格式 - bins为灰度值统计时的组数
- range是所需统计数据的范围,对整张图统计时可以直接使用[0, 256],也可以使用更小的范围进行更精细的观察
如下案例是将灰度值分为32组进行统计:
import cv2
import numpy as np

img = cv2.imread('image/01.jpg',0)
hist,bins = np.histogram(img.ravel(), 32, [0,256])
hist
>> array([  379,  2322,  3149,  3102,  1718,  3379,  3738,  8726,  8409,
       11809,  8753,  3094,  2084,  1580,  1620,  2406,  1886,  2399,
        3793,  5047,  8013, 11870, 15268, 10583, 12241, 12061, 18225,
        9705,  1744,  1517,  3285,  4095], dtype=int64)
bins
>> array([  0.,   8.,  16.,  24.,  32.,  40.,  48.,  56.,  64.,  72.,  80.,
        88.,  96., 104., 112., 120., 128., 136., 144., 152., 160., 168.,
176., 184., 192., 200., 208., 216., 224., 232., 240., 248., 256.])np.bincount()有3个参数,返回一个包含统计结果的数组:

- x为需要统计的数据,以数组形式传入,因而为
img.ravel() - weight为与x同形状的权重值,用于调整统计的比例,在这里我们不需用
- minlength为最少的统计组数,这也可以不填
import cv2
import numpy as np

img = cv2.imread('image/01.jpg',0)
hist=np.bincount(img.ravel(), minlength)
hist
>> array([ 52, 14, 18, 37, ..., 76, 77, 3470], dtype=int64)提示:通常,np.bincount()比np.histogram快10倍,opencv的内置方法cv2.calcHist()方法比np.histogram()快40倍,因而推荐使用opencv的内置方法进行直方图的统计
直方图的绘制
使用Matplotlib中有直方图绘制函数:matplotlib.pyplot.hist()它可以直接统计并绘制直方图。
import cv2
from matplotlib import pyplot as plt

img = cv2.imread('image/01.jpg',0)
plt.figure(figsize=(15,4))
plt.subplot(121), plt.imshow(img, 'gray')
plt.subplot(122), plt.hist(img.ravel(),256,[0,256])
plt.show()
当然,也可以配合cv2.calcHist()方法来绘制更复杂的直方图,如:
import cv2
from matplotlib import pyplot as plt

img = cv2.imread('image/01.jpg')
color = ('b','g','r')

plt.figure(figsize=(16,5))
plt.subplot(121), plt.imshow(img[:,:,::-1])

plt.subplot(122)
for i,col in enumerate(color):
    histr = cv2.calcHist([img],[i],None,[256],[0,256])
    plt.plot(histr,color = col)
    plt.xlim([0,256])
plt.show() 提示:
提示:enumerate()是一种既可以遍历索引又可以遍历元素的方法,其可将数组或列表组成一个索引序列方便使用
直方图均衡化HE
如果拿到了一副整体过亮或过暗的图片,其像素值在直方图上分布很集中,会影响视觉观察;我们可以通过直方图均衡化,将其做一个横向拉伸使其分布在直方图的各个位置上
通常情况下这种操作会很大程度上地改善图像的对比度
OpenCV中的直方图均衡化函数为cv2.equalizeHist(),该函数的输入图片仅仅是一副灰度图像,输出结果是直方图均衡化之后的图像,下边的代码是进行直方图均衡化的案例:
import cv2
from matplotlib import pyplot as plt
img = cv2.imread('image/08.jpg',0)
equ = cv2.equalizeHist(img)
res = np.hstack((img,equ))
plt.figure(figsize=(10,6))
plt.imshow(res, 'gray'), plt.show()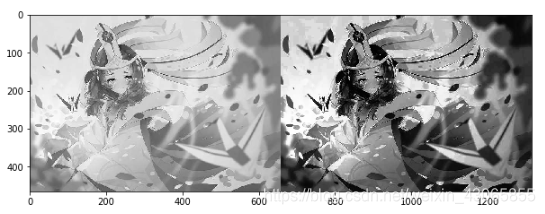 下面简单推导、分析直方图均衡化是经历了一个什么样的处理过程,并用Numpy来实现:
-
若原图灰度值r经过HE变换T后,变为s,则有:$s=T(r)$,变换后的函数值应该仍在灰度取值范围[0, L-1]内,且s应该关于r单调递增(即原本的亮暗不能颠倒)
-
因而,其概率密度有$P(s)=P(T(r))$,用微分可以表示为:
$$ P(s)=P(r)\frac{dr}{ds} \Bigg| _{r=T^{-1}(s)} $$
(该式可以直观地理解为变换前后的概率密度函数下的面积相等)
- 我们假设变换后的s服从均匀分布,即有
$$ P(s)=\frac{1}{L-1} $$
- 因而,综合以上3式,可以解得
$$ s=T(x)=(L-1)\int_0^x p(r)dr $$
-
将其转换为离散形式,即为(L-1)乘以r的累积分布函数的值
-
对于灰度图,(L-1)即为255,而原图的累积分布函数可以用频率代替概率进行统计
如下为Numpy代码对上述过程的实现:
import cv2
import numpy as np
from matplotlib import pyplot as plt

img = cv2.imread('image/08.jpg',0)
plt.figure(figsize=(15,7))
plt.subplot(221), plt.imshow(img,'gray')

# 计算累积分布图
hist,bins = np.histogram(img.flatten(),256,[0,256])
cdf = hist.cumsum()
cdf_normalized = cdf * hist.max()/ cdf.max()
plt.subplot(222)
plt.plot(cdf_normalized, color = 'b')
plt.hist(img.flatten(),256,[0,256], color = 'r')
plt.xlim([0,256])
plt.legend(('cdf','histogram'), loc = 'upper left')

# 构建Numpy掩模数组,cdf为原数组,当数组元素为0时,掩盖(计算时被忽略)
cdf_m = np.ma.masked_equal(cdf,0)
cdf_m = (cdf_m - cdf_m.min())*255/(cdf_m.max()-cdf_m.min())
cdf = np.ma.filled(cdf_m,0).astype('uint8')
img2 = cdf[img]
plt.subplot(223), plt.imshow(img2,'gray')

hist,bins = np.histogram(img2.flatten(),256,[0,256])
cdf = hist.cumsum()
cdf_normalized = cdf * hist.max()/ cdf.max()
plt.subplot(224)
plt.plot(cdf_normalized, color = 'b')
plt.hist(img.flatten(),256,[0,256], color = 'r')
plt.xlim([0,256])
plt.legend(('cdf','histogram'), loc = 'upper left')

plt.show()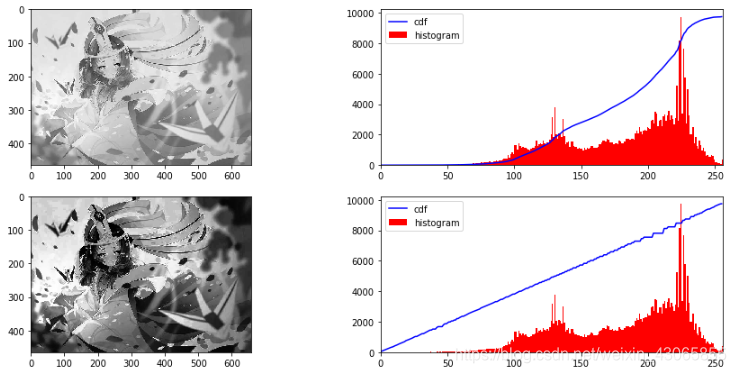
七、图像位运算
在图像的操作中,往往也会用到逻辑运算(按位运算),包括有:AND,OR,NOT,XOR 等,它们主要针对于二值图像,常常用来规划选区(构建掩膜),Opencv提供了如下函数来完成这一操作:
- 与运算
cv2.btwise_and(img1, img2, mask) - 或运算
cv2.bitwise_or(img1, img2, mask) - 非运算
cv2.bitwise_not(img1, mask) - 异或运算(相同为1,不同为0)
cv2.bitwise_xor(img1, img2, mask)
下面的案例综合运用了图像的按位运算,实现了将白色背景的Logo抠图并添加到背景图上的效果:
import cv2
import numpy as np
from matplotlib import pyplot as plt

img1 = cv2.imread('image/B.jpeg')
img2 = cv2.imread('image/logo0.jpg')
rows,cols,channels = img2.shape
roi = img1[0:rows, 0:cols]

# 通过阈值二值化操作滤去白色的背景,得到Logo的掩膜
img2gray = cv2.cvtColor(img2,cv2.COLOR_BGR2GRAY)
ret, mask = cv2.threshold(img2gray, 200, 255, cv2.THRESH_BINARY)
mask_inv = cv2.bitwise_not(mask)
# 通过位运算得到不同的图像效果
img1_bg = cv2.bitwise_and(roi,roi,mask = mask)
img2_fg = cv2.bitwise_and(img2,img2,mask = mask_inv)
dst = cv2.add(img1_bg, img2_fg)
img1[0:rows, 0:cols ] = dst
plt.imshow(img1[:,:,::-1])
plt.show()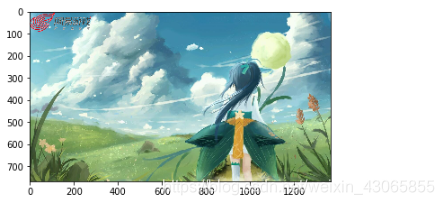
2020年2月25日 本性之初
